


Stefano Garzon: Comparing DOACs SAPT and DAPT After LAAO
Stefano Garzon, Interventional Cardiologist, PhD candidate, shared a post on X about a recent article by Laurent Fauchier et al., published in EuroIntervention, adding:
“Fauchier et al. report that after LAAO, reduced-dose DOAC and single antiplatelet therapy both beat DAPT. One of those two findings survives multiplicity correction, the authors’ own time-zero sensitivity analysis and the contemporary cohort. The other does not.
Post-implantation antithrombotic therapy is one of the few areas in structural intervention with no adequately powered randomised trial. The SCAI/HRS technical review and the 2024 international consensus paper both list it as an open question, and the randomised data we have are ADRIFT, ADALA and ANDES, all small and all short. A large comparative dataset is welcome here.
The authors used the TriNetX network to identify 48,788 AF patients who underwent percutaneous LAAO between 2010 and 2025.
They ran three independent 1:1 propensity score matched comparisons on 89 covariates: reduced-dose DOAC versus DAPT (1,773 pairs), SAPT versus DAPT (4,914 pairs), and reduced-dose DOAC versus SAPT (1,582 pairs). Mean follow-up was 1.4 to 1.6 years.
The primary endpoint was net clinical benefit, a composite of death, ischaemic stroke, myocardial infarction and major bleeding. NCB was 0.866 (0.782 to 0.958) for DOAC versus DAPT, 0.865 (0.814 to 0.920) for SAPT versus DAPT, and 1.056 (0.947 to 1.178) for DOAC versus SAPT.
Let me start with what I think holds up. The three estimates are mutually coherent. If DOAC beats DAPT at 0.866 and SAPT beats DAPT at 0.865, then DOAC versus SAPT should land at 1.001. The observed value is 1.056, a 5.5% discrepancy across three separately matched populations. That is good internal consistency and it is not something you get by accident.
The SAPT versus DAPT comparison is the part of this paper I would defend. I applied Benjamini-Hochberg to the 30 tests in the three main outcome tables, and three survive at FDR 5%: major bleeding (q=0.0008), NCB (q=0.0008) and death (q=0.040), all three from the SAPT block.
It also strengthens when the authors move time zero to day 28 (death 0.737, bleeding 0.825, NCB 0.850, all p<0.0001) and it holds in the 2020 to 2025 restriction (NCB 0.918, 0.843 to 0.999). Intracranial haemorrhage, the one bleeding endpoint that is hard to miscode, moves in the same direction (0.673, 0.487 to 0.929, p=0.02).
Supplementary Appendix 3 is also worth reading on its own. It is a more complete limitations section than most papers of this design carry. Supplementary Figure 3 is self-critical data the authors did not have to publish.
Now the weaknesses, in the order I think they matter.
First, the headline, which reads as reduced-dose DOAC being equivalent to SAPT and both being better than DAPT. I will leave the first half alone. Comparable has become the field’s shorthand for not significantly different, the interval here is 0.947 to 1.178, and arguing about the wording would not change anyone’s practice.
The estimate is also precise enough that a conventional margin for a composite endpoint, had one been declared in advance, would plausibly have been met. On an endpoint this frequent the upper bound is still not a rounding difference.
NCB occurred in 668 of 1,582 (42.2%) with DOAC and in 622 of 1,582 (39.3%) with SAPT over a mean of 1.5 years. The abstract wording,’no clear advantage over SAPT’, is the version I would keep.
The second half is where I would push. The DOAC versus DAPT result does not survive the three stress tests the paper itself supplies. It does not survive multiplicity (NCB q=0.060, death q=0.075, bleeding q=0.075). It does not survive moving time zero to day 28, which the authors ran to address grace-period bias (NCB 0.904, p=0.15; bleeding 0.915, p=0.29).
And in the 2020 to 2025 cohort the NCB interval is 0.939 to 1.242, which excludes the main-analysis estimate of 0.866 and puts the point estimate on the other side of unity.
Mortality behaves differently and deserves the distinction: the post-2020 interval (0.717 to 1.217) still contains 0.789, so that one is imprecision rather than contradiction. What comes out of the paper as durable is SAPT over DAPT, not DOAC over DAPT.
Second, proportional hazards. Supplementary Table 7 shows that roughly half of all non-fatal events occurred in the first 90 days (NCB 48% and 51%; major bleeding 50% and 52%; stroke 46% and 49%), against 14% of deaths. The early stroke rate runs around 22%/year and about 5.6%/year afterwards.
The methods state that Schoenfeld residuals were tested formally and that, if violations were found, risk ratios over the full follow-up would be reported.
Hazard ratios are reported in every table and no test result appears anywhere. I could not find it in the supplement either. With that much front-loading, the shape of the hazard matters, and RMST would have been informative.
Third, what ‘major bleeding’ means here. Supplementary Table 1 lists the codes, and they include R31 (haematuria), R04 (respiratory tract haemorrhage, which contains epistaxis), N93 (abnormal uterine bleeding, in a cohort of mean age 78 and 53% men), M25.0 (haemarthrosis) and S06.4 (traumatic extradural haemorrhage). The observed rate is 13.8 to 15.3%/year.
The paper never claims BARC or ISTH equivalence and the code list is published, so this is transparent rather than hidden. It still matters for two reasons. With 515 bleeding events against 757 NCB events, this component carries most of the composite. And a composite that weights coded haematuria the same as death is difficult to translate into a bedside decision.
Fourth, residual confounding, quantified. I calculated E-values using the VanderWeele approximation for common outcomes. At the confidence limit nearest the null they are 1.20 for mortality in the DOAC comparison, 1.21 for NCB, 1.24 for mortality in the SAPT comparison and 1.43 for bleeding in the SAPT comparison.
An unmeasured confounder associated about 1.2-fold with both treatment assignment and death erases the mortality findings. Frailty, cognition and functional status are precisely the variables the authors list as unavailable. There is a pattern here worth naming.
Two strategies that are pharmacological opposites on the thrombotic axis reduce all-cause mortality against DAPT by a similar amount (0.789 and 0.839). The common factor is not being on DAPT, which is a property of the prescriber rather than of the drug.
Selection of the patient judged able to tolerate anticoagulation would push in exactly this direction, and it is at least as plausible as the alternatives.
Fifth, two thrombotic signals that go undiscussed. In the day-28 time zero analysis, device-related or intracardiac thrombosis with DOAC versus DAPT is 2.153 (1.050 to 4.418, p=0.03). In the post-2020 cohort, ischaemic stroke is 1.325 (1.003 to 1.751, p=0.05), with 113 against 88 events.
Both are exploratory and both sit under the same multiplicity problem I raised above, so I would not call them harm. The text does describe which comparisons lost significance in the contemporary cohort and does not mention the one that gained it in the other direction.
The conclusion of ‘no apparent excess of thromboembolic events’ is harder to hold once you have read those two panels.
Sixth, and this one is a question rather than a criticism. I could not reconcile the ‘yearly rate, %’ columns. Dividing events by the reported annual rate gives 3,796 person-years for NCB in the DOAC arm, against a ceiling of 2,482 (1,773 patients × 1.4 years), and it gives more time at risk for non-fatal endpoints than for death, which cannot happen.
Absolute effect is not reported anywhere, and the crude counts are close to identical (death 202 vs 206, NCB 757 vs 757, bleeding 515 vs 526), so I cannot produce an ARR or an NNT from the published data. If someone can tell me how TriNetX defines that denominator, I would like to know.
To wrap this up, what I think the paper establishes: after LAAO, single antiplatelet therapy is associated with less coded bleeding, less intracranial haemorrhage and lower mortality than DAPT, and that association survives multiplicity correction, the time zero shift and the contemporary restriction.
Routine DAPT after LAAO does not have an empirical basis stronger than the alternatives. Reduced-dose DOAC and SAPT produced comparable net clinical benefit, in the sense the field uses that word. That is a useful finding on its own. A formal claim of equivalence would have needed a margin set in advance.
What it does not establish: that reduced-dose DOAC beats DAPT in contemporary practice, or causality for any of the three. The early mortality advantage of DOAC over SAPT in the 0 to 90 day analysis has a fragility index of 1, and the authors themselves flag it as not persisting.
Next stop is a randomised trial with time zero at discharge, SAPT against reduced-dose DOAC against DAPT, bleeding by BARC 3 to 5, device-related thrombosis on a fixed imaging protocol, blinded adjudication, and an equivalence margin declared in advance if the question is DOAC against SAPT.
Until that exists, this is the largest comparative dataset we have and it moves the field, which is why it deserves to be read down to the supplement.
For those of you doing LAAO regularly, what are you discharging on, and has anything in the last two years changed it?”
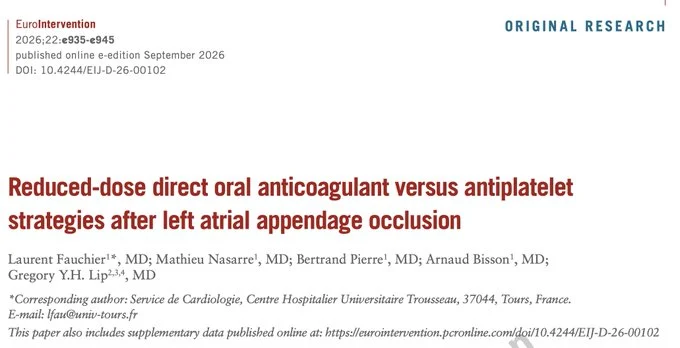
Title: Reduced-dose direct oral anticoagulant versus antiplatelet strategies after left atrial appendage occlusion
Authors: Laurent Fauchier, Mathieu Nasarre, Bertrand Pierre, Arnaud Bisson, Gregory Y.H. Lip
Stay updated on all scientific advnaces with Hemostasis Today.
-
Sep 19, 2026, 01:18Elad Asher: What Should a Patient Take after Left Atrial Appendage Occlusion?
-
Sep 19, 2026, 00:48Mahmoud Mehawed: Heparin vs Warfarin vs DOACs Understanding the Key Differences
-
Sep 18, 2026, 17:48Ronak H. Mistry: Updated ASH Guidelines Bring New Focus to Iron Deficiency
-
Sep 18, 2026, 17:32Hassan Kawtharany: New Ferritin Cutoffs for the Diagnosis of Iron Deficiency With or Without Anemia
-
Sep 18, 2026, 17:20Abhishek G P: GAVE as an Important Cause of Chronic Gastrointestinal Blood Loss
-
Sep 18, 2026, 17:08Irem Karaman Sebin: ASH 2026 Changes a Key Concept in Iron Deficiency
-
Sep 18, 2026, 16:51Adarsh Krishnan Sundara Rajan: Is VTE the Most Underdiagnosed Critical Threat in Modern Healthcare?
-
Sep 18, 2026, 16:19CRISPR and Hemophilia: The Next Frontier of In Vivo Gene Editing
-
Sep 18, 2026, 16:13Christian Irsara: PF4 Immunothrombosis Following Natural Adenovirus Infection