


Shamee Shastry: Chart Before You Chase – Diagnosing Drug-Induced Hemolytic Anemia
Shamee Shastry, Professor and Head of the Department of Immunohematology and Blood Transfusion at Kasturba Medical College, Manipal, shared on LinkedIn:
“Chart before you Chase!
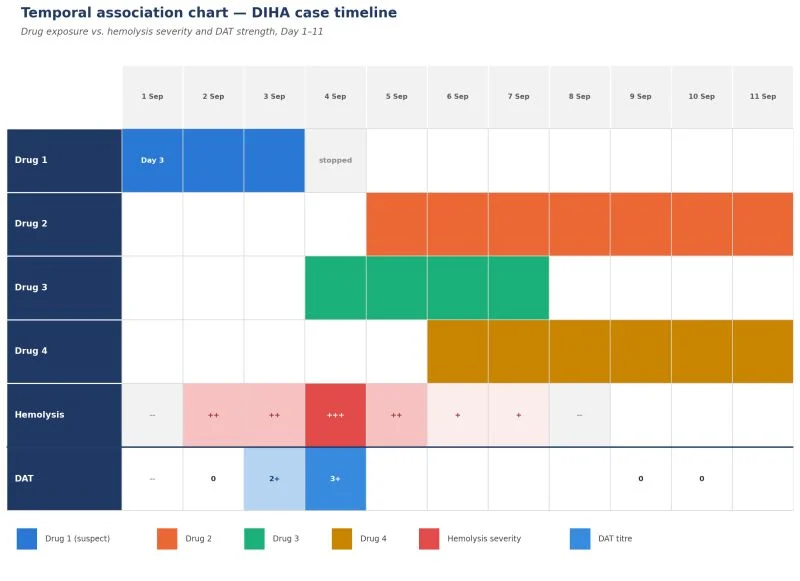
Why a simple timeline can be your most powerful diagnostic tool in Drug-Induced Hemolytic Anemia (DIHA).
When a patient on multiple medications develops sudden hemolysis, the real challenge isn’t recognising hemolysis, it’s identifying which drug caused it.
This is where a temporal association chart becomes indispensable.
By mapping every drug’s start and stop date against the day of hemolysis onset, hemolysis severity, and serial DAT results on a single timeline, patterns that are invisible in a case note become obvious at a glance:
Temporal plausibility: onset follows drug exposure within a biologically credible window, not before it.
A structured temporal chart doesn’t replace clinical judgement or serological workup (DAT, eluate, drug-dependent antibody testing), but it focuses that workup on the right suspect.”
Other posts featuring Shamee Shastry on Hemostasis Today.
-
Sep 14, 2026, 20:46Nupur Choudhury: Exploring AI-Based Detection of Anemia Using Eye and Fingernail Images
-
Sep 14, 2026, 20:43David Reiner: Blood Tests That Can Reveal Nutrition Clues
-
Sep 14, 2026, 20:40Giuseppe Biondi Zoccai: Balancing Thrombosis and Bleeding in Acute MI With Hemophilia A
-
Sep 14, 2026, 20:39Kemal Karaagac: Kounis Syndrome as a Possible Cause of Very Late Stent Thrombosis
-
Sep 14, 2026, 20:38Mirvat Alasnag: IVUS and OCT Guided PCI Reduce MACE, Revascularization and Stent Thrombosis
-
Sep 14, 2026, 16:14Susanne Lager: Isthmin-2 Emerges as an Early Predictor of Pregnancy Complications
-
Sep 14, 2026, 15:53Leonard Valentino: Advancing a New Model of Patient-Led Research
-
Sep 14, 2026, 15:48Adishwar Rao: LAAC vs Oral Anticoagulation in Atrial Fibrillation
-
Sep 14, 2026, 15:36Lesley Van Wyk: Hemolytic Anemia Quick Revision – Tips and Tricks