


Tareq Abadl: Your Blood Tells Your Story – Even in the Shape of Its Cells
Tareq Abadl, Medical Lab Specialist, shared a post on LinkedIn:
“‘Your blood tells your story… even in the shape of its cells’
Sometimes, blood has a ‘dual personality’!
Red Blood Cells (RBCs) should ideally be uniform in size and color. However, in some cases, we find ‘two different teams’ within the same sample.
Scientists call this:
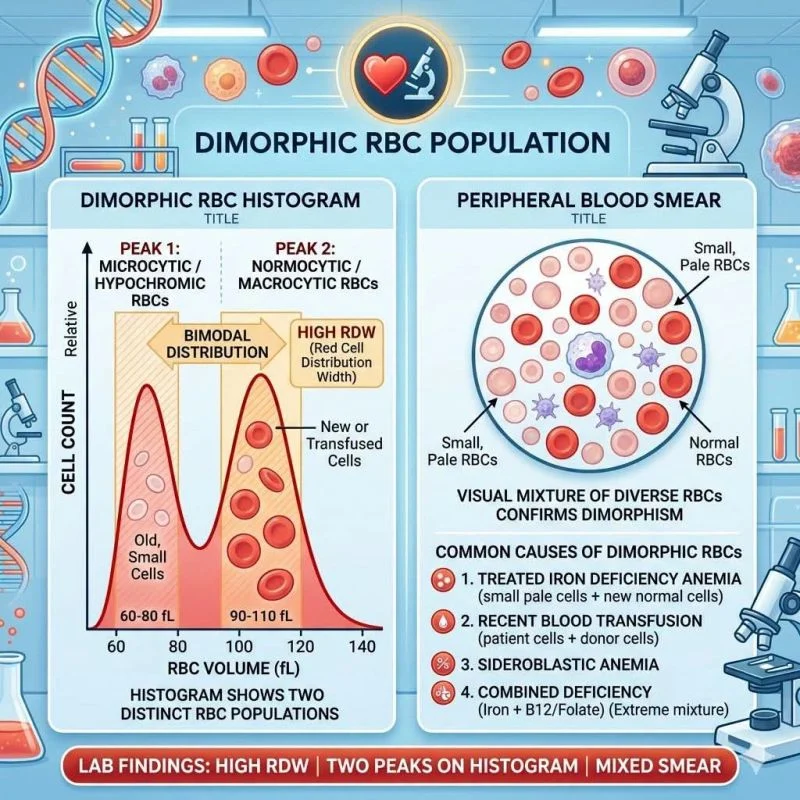
Dimorphic RBC population is the presence of two distinct populations of red blood cells in the same sample.
On the Histogram:
Normally, the curve should have a single peak.In this case, we see two clear, distinct peaks (like two waves).
- The first peak: Small, pale cells (Microcytic with Hypochromic).
- The second peak: Normal or larger cells (Normocytic or Macrocytic).
On the Peripheral Blood Smear:
The view is a mixture: small, pale cells alongside normal or larger cells.
The presence of two distinct groups confirms Dimorphism.
Lab Findings:
RDW (Red Cell Distribution Width) is significantly elevated, indicating a wide variation in cell size.
The histogram confirms the presence of two peaks.
The smear reveals two different populations of RBCs.
Common Causes:
- Treated Iron Deficiency Anemia:
Old cells: Microcytic, Hypochromic.
New cells (post-treatment): Normocytic, Normochromic.
- Recent Blood Transfusion:
Patient’s cells: Abnormal.
Donor’s cells: Normal.
- Sideroblastic Anemia: Defect in hemoglobin synthesis within the bone marrow.
- Combined Deficiency: Such as Iron deficiency with Vitamin B12 or Iron deficiency with Folate deficiency.
Clinical Scenarios:
1.A patient started iron therapy two weeks ago. The histogram will show two peaks: one for the old small cells, and another for the new, normal cells.
Question:
If you see this pattern, what would you conclude is the cause?
2.A patient had a blood transfusion two days ago. The smear will show a mixture of the patient’s abnormal cells and the donor’s normal cells.
Question:
What does this specific mixture indicate?
3.A patient with a combined deficiency (Iron with B12) → The smear will show very small cells next to very large ones.
Question:
What could cause the blood to appear as such an ‘extreme’ mixture?
The Scientific takeaway:
Blood is not just numbers in a lab report… it is a living record that tells the story of treatment, nutrition, and even medical history. Just a glance at the histogram or the smear can reveal many secrets about a patient’s condition.
‘Your blood tells your story… even in the shape of its cells ‘”
Other posts featuring Tareq Abadl on Hemostasis Today.
-
Sep 19, 2026, 18:03Manisha Madkaikar: Clinical, Hematological, and Molecular Features of Sickle β-Thalassemia
-
Sep 19, 2026, 17:24Jan Shawqi Goran: Understanding Beta Thalassemia Before Marriage Testing
-
Sep 19, 2026, 14:17Abdul Mannan: What Exactly Is a Platelet?
-
Sep 19, 2026, 13:39Keisuke Goda: Decoding Platelet Phenotypes in COVID-19 With Optofluidic Imaging
-
Sep 19, 2026, 13:30Targeted Thrombolysis Beyond tPA
-
Sep 19, 2026, 13:21Paul Armstrong: From Summer Studentship to Young Researcher
-
Sep 19, 2026, 13:06Rabiya Masood: Breaking the Cycle of Thalassemia Through Screening
-
Sep 19, 2026, 10:52Consuela A. Albright: The Critical Role of Black Blood Donors in Sickle Cell Treatment
-
Sep 19, 2026, 10:47Amber Yates: Inside Agios’ Partnership with the Sickle Cell Community